
HOW TO MAKE MONEY BY KNOWING WELL SUPPORT AND RESISTANCE
maybe now you are passionate about trading, so you start studying the main indicators in technical analysts. One of them of course is support and resistance.
At first glance, support and resistance look easy to see because they are just dots. However, using these two indicators is quite tricky for beginners. However, the analytical technique to find out is quite easy to learn. You also need to understand the points of support and resistance considering the benefits are quite good in technical analysis. Because understanding these points can make you more optimal.
Therefore, let's see, an easy way to determine support and resistance for beginners!
Understanding Support and Resistance for Beginners
Before discussing further, it's a good idea to get
acquainted with support and resistance. Support and resistance are two of the
most fundamental things in technical analysis. Usually, traders use support and
resistance levels to determine the price level on the price chart of an asset
What is Support?
Support is the lower limit of the stock price that will be difficult for traders in the capital market to break within a certain period of time. Not only stocks, this concept also applies to other markets such as the crypto market and the derivatives market.
Support is indicated by a horizontal or slightly sloping line that is at the lower border of the chart. This limit becomes a benchmark for traders to start hoarding stocks or other instruments that are allegedly discounted.
When prices are in a downtrend, additional technical analysis indicators such as moving averages can be used to accurately determine support. Even though it has approached the support line historically, analysis is needed so you can gauge whether the price will move up or stagnate.
It could be that the price breaks through its support and
looks for a new equilibrium below the existing support. Obviously, this point
tells you when you can start entering the market or you can wait until a new
equilibrium is established.
What is Resistance?
Conversely, when prices creep up, you can get ready to take money by setting a selling price. If likened to a building, support is the floor and resistance is the top of the roof.
If you don't have a coin or stock whose price is in the resistance area, this is the time for you to be a spectator. Because, at this time, an instrument can be said to be too expensive.
But sometimes, traders who are provoked by fundamental conditions or existing trends even launch a buying action. As a result, the resistance line may be broken and a new balance is formed.
How to make money through support and resistance for beginners
Support and resistance is not a guarantee that you will make money in today's market. However, this concept will help you determine the momentum of entering and exiting the market.
The following are some basic analyzes that can help you determine support and resistance.
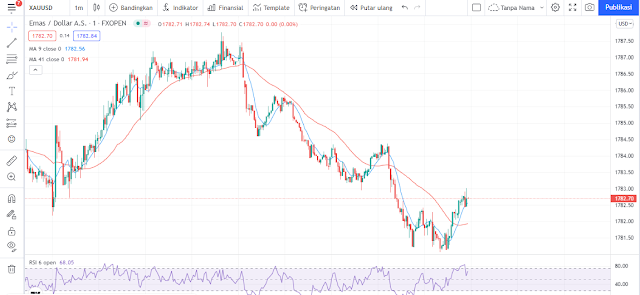
In this method you will find that up and down trends often have a visible direction. An uptrend occurs when the highest price is defeated by a higher high. Meanwhile, a downtrend is the opposite, when the trend forms deeper and deeper troughs.
Trendlines is a very easy and applicable method. However, its use must still be combined with other analytical methods such as moving averages.
Major Minor in Determining Support and Resistance
Support and resistance levels are sometimes in the form of pseudo or minor movements, usually these will not last long. This often happens when asset price movements are making a down or up trend.
What is the example like?
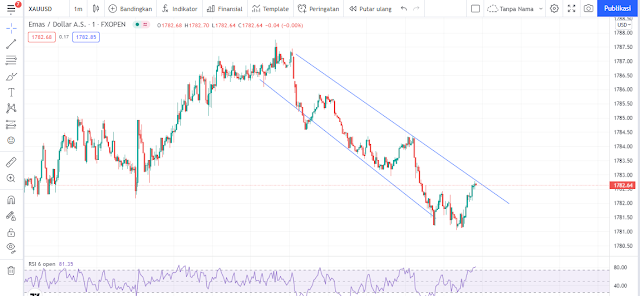
For example, if the price trend is sloping, of course the price position will continue to fall. not long after, the price of the asset then bounced. However, the price then started to fall again because the trend in general was still going down. Well, that brief bounce is called a minor move.
This also applies when the price trend is up. Usually a minor movement occurs when the price slopes down before finally shooting up to a newer resistance point.
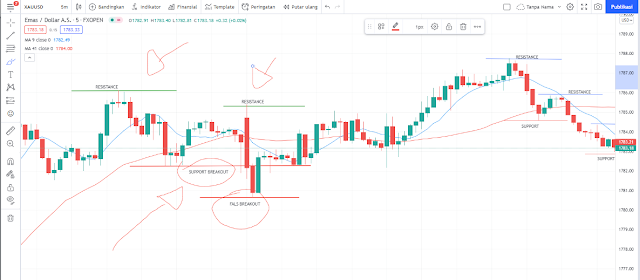
If loaded into the graph, then the example will be like this.
In the example above, it can be seen that a minor movement occurs during an uptrend or downtrend.
In a downtrend, if the price drops below its minor support level, then we can understand that the downward trend will still continue. However, if the price stops and bounces towards a higher support point than before, it can be said that the direction of price movement has changed.
Understanding these minor movements is very useful because it can determine your position to enter and exit the market. Maybe you can decide to enter the market if there is support in an uptrend. Vice versa.
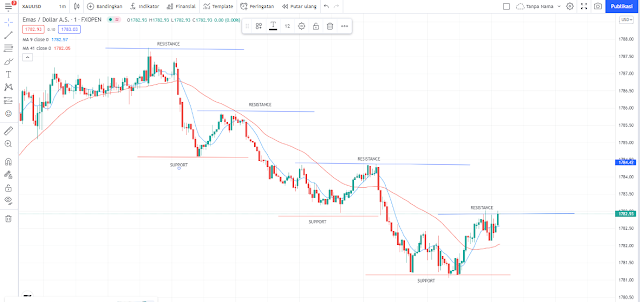
Meanwhile, the major support and resistance areas are the lowest and highest price levels that can cause an asset price trend reversal. How about an example?
If the price is experiencing an uptrend and then reverses a downtrend, then the price when the reversal occurs is a strong resistance level (as shown in the chart above). Well, the peak is called the major resistance.
Meanwhile, major support is the lowest price point, where the trend will reverse from a downtrend to an uptrend.
Major support and resistance occur as a reflection of the
actions of market participants. They usually buy when there is major support,
so the price of an asset reverses higher after that. On the other hand,
profit-taking also occurs when the price breaks through a major resistance,
causing the price to crash afterwards.
False Breakout
Asset prices will often move a little further than we expect. This rarely happens. But, even if it happens, this condition is called a false alarm or false breakout.
False alarms are actually very good opportunities in trading. Because, it is the key to make money, especially when the market is bullish.
For example, the price of an asset is in an uptrend. However, the price suddenly returned towards its support, even lower. Well, you can do that opportunity to accumulate these assets before the price rallies again. Once the price has peaked, of course you can take profit taking.
Similarly, if the trend is down, and price pulls back into resistance, let price break above resistance and then short-sell when price starts to drop below resistance.
The downside of this approach is that a false breakout will not always occur. Therefore, it is best to take trading opportunities when the momentum comes. Next time, if a false breakout occurs, let's just say that you are being hit by a windfall, okay?