
HOW TO USE SMA9 AND SMA41 IN QUOTEX

Here I will explain about the use of the SMA9 and SMA41 Moving average indicators that I usually use in Quotex
For those of you who want to use it on a demo account CLICK HERE
First I will tell you how to setup the indicator


CHOOSE SMA9 THEN SMA41
In the picture above you can go to the indicator menu and select a moving average with SMA 9 type. I usually use green for SMA9. Then in the next picture, you click the indicator menu again then select moving average and flat SMA41 type, I usually use red
Both of these indicators are very helpful when you trade, how to use them, you trade following the trend on the condition that after the SMA9 and SMA41 competition
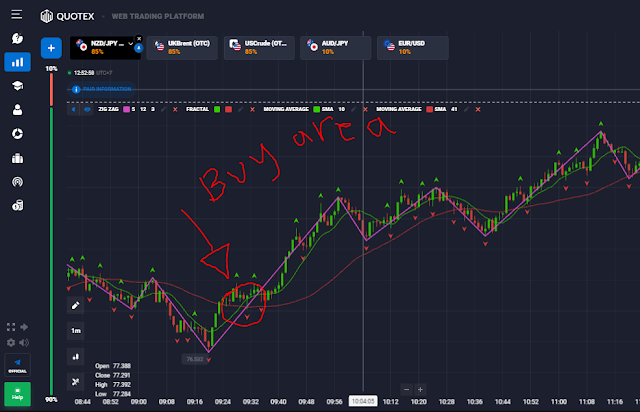
The picture above shows a SMA cross in an uptrend, where do we start to open the position?
So after the cross, wait for one or two confirmation candles first, if the candle gives an up signal or there is a green candle confirmation, then the fix trend turns into an uptrend, that's where you can open buy. For the duration you adjust the bias starting with 1-3 minutes

The picture above shows a SMA cross in a downtrend, where do we start to open the position?
So after the cross, wait for one or two confirmation candles first, if the candle gives a signal to go down or there is a red candle confirmation, then the fix trend turns into a downtrend, that's where you can open sell. For the duration, you adjust the bias starting with 1-3 minutes, this is the opposite of an uptrend cross
Things to pay attention to when using this indicator
- Always pay attention to support and resistance
If support and support meet you, don't try to open it for 1 minute because most of the time there will be reversals

In the example picture above, when support and support meet, there are many possibilities for the candle to make a reversal for several candles, so at that time avoid opening for 1 minute.
And conversely, if resistance meets resistance we must also be careful not to open 1 minute because we can see the bias in the picture above when resistance meets parallel or even passes through the previous resistance the candle makes a correction or reversal
- Pay attention to TimeFrame 5 and 10
At the beginning and at the end of TF 5 or even 10, most markets make corrections, for example, we are trading in an uptrend, even though there is already a SMA9 and SMA41 crossing when we open buy the candle is down or red, so we check on TF5 or 10 minutes the conclusion is at the beginning and end TF5 and 10 minute candle mostly make corrections or reversals
Thus the explanation of the use of SMA9 and SMA41 indicators.
For additional indicators, I usually use Fractal and Zig zag, maybe in the next article I will explain the additional indicators.
Now all you have to do a lot of practice on a demo account first before on a real account
Hopefully this article can help add to your insight in the world of trading, share this article with your friends